dane ze strony https://volcano.si.edu/
Analiza dotyczy danych, gdzie najwcześniej zanotowany wybuch wulkanu odbył się w roku 11345 przed Chrystusem, a najnowsze dane dotyczą wybuchów z 2022 roku.
W przeciągu tego czasu wystąpiło 7 wybuchów o najwyższej skali VEI. Najnowszy taki wybuch wystąpił w roku 1812 i jest to jedyny wybuch jaki został bezpośrednio zanotowany/zgłoszony, o wszystkich wcześniejszych wybuchach tej skali wiemy dzięki badaniom geologicznym.
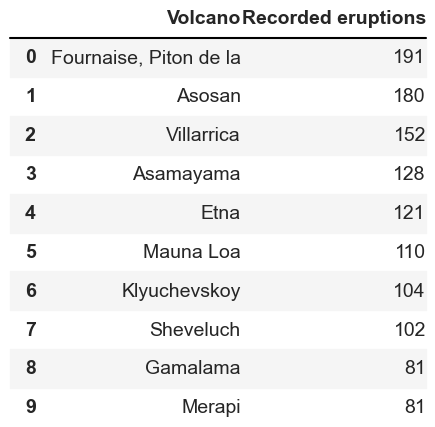
Najaktywniejszym wulkanem w danych jest Piton de la Fournaise, z wynikiem 191. Dla ośmiu wulkanów zanotowano ponad 100 wybuchów.
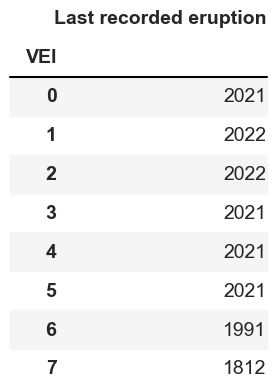
Wybuchy skal 0-5 występują cały czas, natomiast skala 6 ostatni raz miała miejsce w 1991 roku, a skala 7, jak wcześniej wspomniane, w 1812.

Najdłużej trwającą erupcją jest erupcja wulkanu Yasur. Rozpoczęła się ona (około) 1270 roku i trwa aż do dzisiaj.
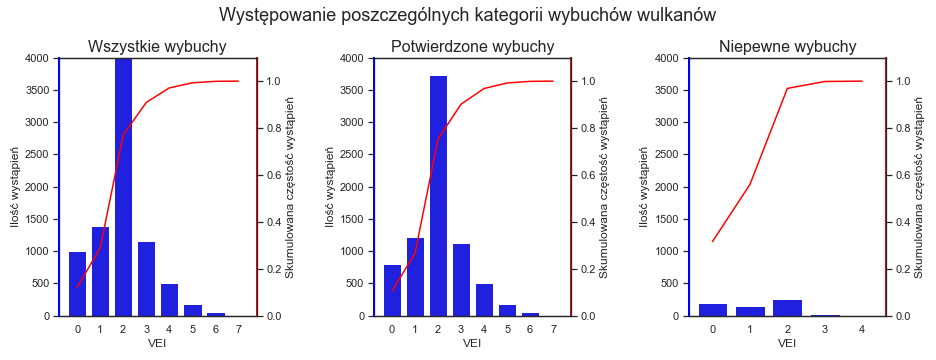
Najwięcej odnotowanych wybuchów ma wartość 2 w skali VEI i występują one około 2.5 razy częściej niż skale 1 lub 3. Większość z wybuchów w danych to wybuchy potwierdzone, niewielka część z całości to wybuchy niepewne.

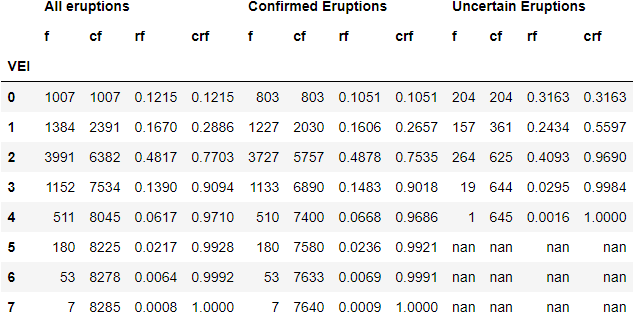
Wizualizacja powyższej tabeli:

Dane o erupcjach wulkanów można pozyskiwać za pomocą różnych metod. Poniżej tabela przedstawiająca typy i metody wykrywania erupcji, wraz ze zliczeniami ile erupcji zostało wykrytych za pomocą poszczególnych metod, wraz z podziałem według wartości VEI:

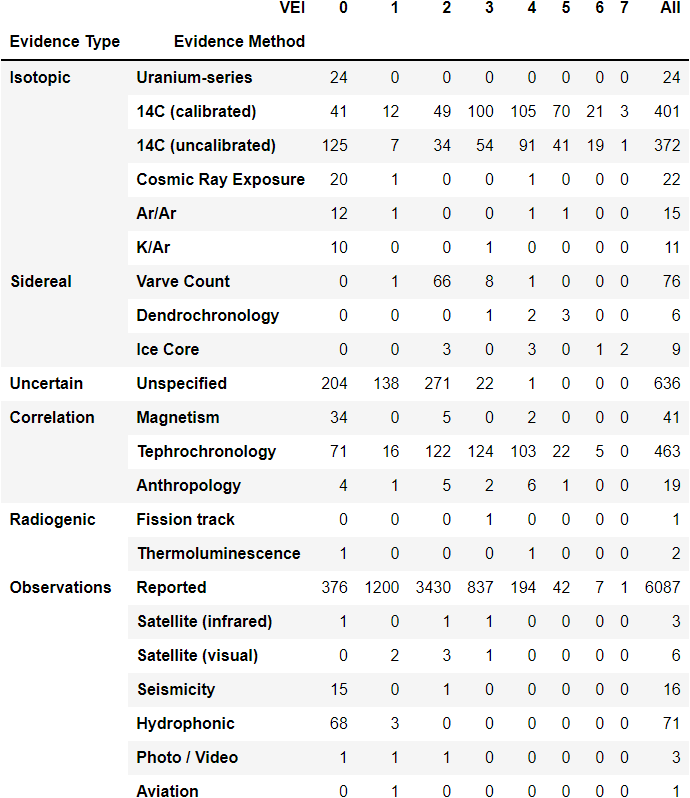
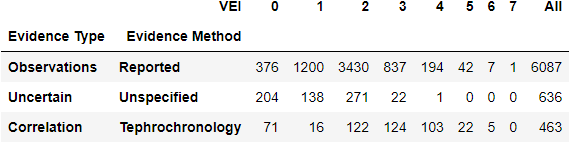
Jak widać w zamieszczonej poniżej tabeli, głownym źródłem dostarczania informacji o erpucjach wulkanów były po prostu naoczne obserwacje tych zjawisk. Nie licząc pozyskiwania danych z nieznanych źródeł kolejną najczęściej używaną grupą metod pozyskiwania danych o erupcjach są metody tefrochronologiczne, polegające na badaniu warstw tefry zbudowanych z popiołów wulkanicznych.

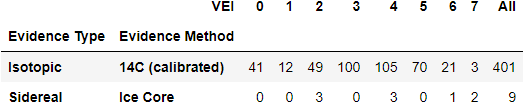
Jeśli chodzi o najsilniejsze erupcje o wartości VEI równej 7 to głównymi metodami informującymi nas o tych erupcjach były datowanie przy użyciu izotopu węgla 14c, oraz analiza Rdzenia lodowego, co pokazuje poniższa tabela:
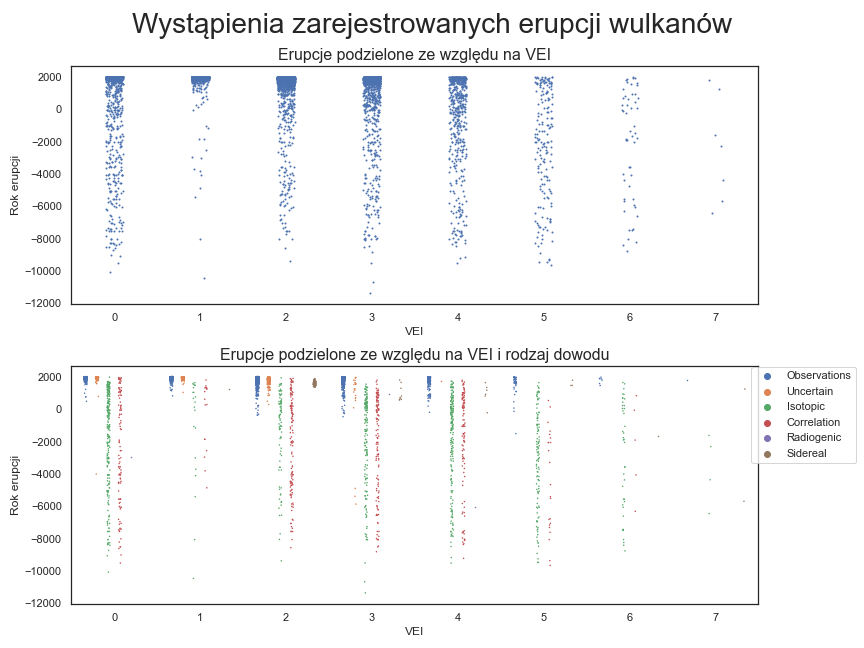
Korzystając z danych i wykresów można zauważyć, że dużo więcej erupcji zostało zarejestrowanych na przestrzeni ostatnich kilkuset lat, w porównaniu do poprzednich tysiącleci. Ma na to wpływ dużo czynników, jednak biorąc pod uwagę, że większość danych stanowią naoczne obserwacje erupcji, więc naturalnie będzie ich więcej w czasach, gdzie powszechność i wymienność informacji jest dużo większa. Można śmiało powiedzieć, że czynniki geologiczne nie miały wielkiego wpływu na zwiększenie częstotliwości rejestrowania wybuchów.
Dobrze pokazują to poniższe wykresy, gdzie zaznaczone kolorem niebieskim na dolnym wykresie dane pochodzą z naocznych obserwacji. Widzimy dużo większą czestotliwość tych obserwacji w ostatnich kilku wiekach, natomiast w przypadku innych metod potwierdzania erupcji dane są rozłożone dużo bardziej równomiernie na przestrzeni lat.

import numpy as np
import pandas as pd
import scipy as sp
import matplotlib as mpl
import matplotlib.pyplot as plt
import seaborn as sns
import dataframe_image as dfi
sns.set()
sns.set_theme(style="whitegrid")
dane=pd.read_csv('raw_data.csv', header=1)
eruptions_data=dane[['Eruption Number','Volcano Name','Eruption Category','VEI','Start Year','Start Month','Start Day','End Year','End Month','End Day']]
kolumny=dane['Evidence Method (dating)'].str.split(': ',expand=True)
kolumny=kolumny.rename(columns={0: "Evidence Type", 1: "Evidence Method"})
eruptions_data=eruptions_data.join(kolumny)
eruptions_data['Evidence Type'].fillna('Uncertain',inplace=True)
eruptions_data['Evidence Method'].fillna('Unspecified',inplace=True)
eruptions_data=eruptions_data.set_index('Eruption Number')
eruptions_data=eruptions_data[eruptions_data['Eruption Category']!='Discredited Eruption']
eruptions_data=eruptions_data[eruptions_data['VEI'].notna()]
eruptions_data['Eruption Category']=eruptions_data['Eruption Category'].str.replace(' Eruption', '')
eruptions_data['Start Day']=eruptions_data['Start Day'].replace(0,np.nan)
eruptions_data['Start Month']=eruptions_data['Start Month'].replace(0,np.nan)
eruptions_data['End Day']=eruptions_data['End Day'].replace(0,np.nan)
eruptions_data['End Month']=eruptions_data['End Month'].replace(0,np.nan)
eruptions_data.to_csv('eruptions_data.csv')
eruptions_data.style.format(precision=0).hide(subset=eruptions_data.index[10:-10],axis=0)
| Volcano Name | Eruption Category | VEI | Start Year | Start Month | Start Day | End Year | End Month | End Day | Evidence Type | Evidence Method | |
|---|---|---|---|---|---|---|---|---|---|---|---|
| Eruption Number | |||||||||||
| 22486 | Cotopaxi | Confirmed | 2 | 2022 | 10 | 21 | 2022 | 12 | 19 | Observations | Reported |
| 22481 | Taal | Confirmed | 1 | 2022 | 10 | 5 | 2022 | 10 | 29 | Observations | Reported |
| 22458 | Turrialba | Confirmed | 1 | 2022 | 7 | 17 | 2022 | 7 | 17 | Observations | Reported |
| 22453 | Ulawun | Confirmed | 2 | 2022 | 6 | 2 | 2022 | 6 | 2 | Observations | Reported |
| 22454 | Raung | Confirmed | 2 | 2022 | 5 | 14 | 2022 | 9 | 27 | Observations | Satellite (infrared) |
| 22445 | Gaua | Confirmed | 1 | 2022 | 5 | 3 | 2022 | 5 | 3 | Observations | Reported |
| 22451 | Purace | Confirmed | 1 | 2022 | 3 | 29 | 2022 | 3 | 29 | Observations | Reported |
| 22430 | Ambrym | Confirmed | 1 | 2022 | 1 | 25 | 2022 | 2 | 2 | Observations | Reported |
| 22456 | Chikurachki | Confirmed | 2 | 2022 | 1 | 17 | 2022 | 10 | 17 | Observations | Satellite (visual) |
| 22431 | Wolf | Confirmed | 2 | 2022 | 1 | 6 | 2022 | 4 | 14 | Observations | Reported |
| 14557 | Tongariro | Confirmed | 5 | -9450 | nan | nan | nan | nan | nan | Isotopic | 14C (calibrated) |
| 14530 | Taupo | Confirmed | 5 | -9460 | nan | nan | nan | nan | nan | Isotopic | 14C (calibrated) |
| 18091 | Towada | Confirmed | 3 | -9490 | nan | nan | nan | nan | nan | Isotopic | 14C (calibrated) |
| 19487 | Khangar | Confirmed | 4 | -9500 | nan | nan | nan | nan | nan | Isotopic | 14C (calibrated) |
| 12954 | Theistareykir | Confirmed | 0 | -9500 | nan | nan | nan | nan | nan | Correlation | Tephrochronology |
| 14556 | Tongariro | Confirmed | 5 | -9650 | nan | nan | nan | nan | nan | Correlation | Tephrochronology |
| 21101 | Craters of the Moon | Confirmed | 0 | -10060 | nan | nan | nan | nan | nan | Isotopic | 14C (uncalibrated) |
| 22141 | Igwisi Hills | Confirmed | 1 | -10450 | nan | nan | nan | nan | nan | Isotopic | Cosmic Ray Exposure |
| 22351 | Quetrupillan | Confirmed | 3 | -10658 | nan | nan | nan | nan | nan | Isotopic | 14C (calibrated) |
| 22352 | Quetrupillan | Confirmed | 3 | -11345 | nan | nan | nan | nan | nan | Isotopic | 14C (calibrated) |
big_eruptions_data=eruptions_data[eruptions_data['VEI']==7]
dfi.export(big_eruptions_data.style.format(precision=0), 'vei7.png',table_conversion='matplotlib')
big_eruptions_data.style.format(precision=0)
| Volcano Name | Eruption Category | VEI | Start Year | Start Month | Start Day | End Year | End Month | End Day | Evidence Type | Evidence Method | |
|---|---|---|---|---|---|---|---|---|---|---|---|
| Eruption Number | |||||||||||
| 16231 | Tambora | Confirmed | 7 | 1812 | nan | nan | 1815 | 7 | 15 | Observations | Reported |
| 20843 | Rinjani | Confirmed | 7 | 1257 | 7 | 1 | nan | nan | nan | Sidereal | Ice Core |
| 13879 | Santorini | Confirmed | 7 | -1610 | nan | nan | nan | nan | nan | Isotopic | 14C (calibrated) |
| 20904 | Blanco, Cerro | Confirmed | 7 | -2300 | nan | nan | nan | nan | nan | Isotopic | 14C (calibrated) |
| 16980 | Kikai | Confirmed | 7 | -4350 | nan | nan | nan | nan | nan | Isotopic | 14C (uncalibrated) |
| 20610 | Crater Lake | Confirmed | 7 | -5680 | nan | nan | nan | nan | nan | Sidereal | Ice Core |
| 18903 | Kurile Lake | Confirmed | 7 | -6440 | nan | nan | nan | nan | nan | Isotopic | 14C (calibrated) |
most_active_data=eruptions_data['Volcano Name'].value_counts().rename_axis('Volcano').reset_index(name='Recorded eruptions')
dfi.export(most_active_data.head(10), 'najaktywniejsze.png',table_conversion='matplotlib')
most_active_data.head(10)
| Volcano | Recorded eruptions | |
|---|---|---|
| 0 | Fournaise, Piton de la | 191 |
| 1 | Asosan | 180 |
| 2 | Villarrica | 152 |
| 3 | Asamayama | 128 |
| 4 | Etna | 121 |
| 5 | Mauna Loa | 110 |
| 6 | Klyuchevskoy | 104 |
| 7 | Sheveluch | 102 |
| 8 | Gamalama | 81 |
| 9 | Merapi | 81 |
last_eruption_data=eruptions_data.groupby(['VEI']).max('Start Year')[["Start Year"]].rename(columns={'Start Year':'Last recorded eruption'})
last_eruption_data.index=last_eruption_data.index.astype(int)
dfi.export(last_eruption_data.style.format(precision=0), 'ostatnie.png',table_conversion='matplotlib')
last_eruption_data.style.format(precision=0)
| Last recorded eruption | |
|---|---|
| VEI | |
| 0 | 2021 |
| 1 | 2022 |
| 2 | 2022 |
| 3 | 2021 |
| 4 | 2021 |
| 5 | 2021 |
| 6 | 1991 |
| 7 | 1812 |
vei_data_1=eruptions_data.groupby('VEI').count()[['Volcano Name']]
vei_data_1.rename(columns={'Volcano Name':'f'},inplace=True)
count=sum(vei_data_1['f'])
vei_data_1['cf']=vei_data_1['f'].cumsum()
vei_data_1['rf']=vei_data_1['f']/count
vei_data_1['crf']=vei_data_1['rf'].cumsum()
vei_data_1.index = vei_data_1.index.astype("int")
vei_data_2=eruptions_data[eruptions_data['Eruption Category']=='Confirmed'].groupby('VEI').count()[['Volcano Name']]
vei_data_2.rename(columns={'Volcano Name':'f'},inplace=True)
count=sum(vei_data_2['f'])
vei_data_2['cf']=vei_data_2['f'].cumsum()
vei_data_2['rf']=vei_data_2['f']/count
vei_data_2['crf']=vei_data_2['rf'].cumsum()
vei_data_2.index = vei_data_2.index.astype("int")
vei_data_3=eruptions_data[eruptions_data['Eruption Category']!='Confirmed'].groupby('VEI').count()[['Volcano Name']]
vei_data_3.rename(columns={'Volcano Name':'f'},inplace=True)
count=sum(vei_data_3['f'])
vei_data_3['cf']=vei_data_3['f'].cumsum()
vei_data_3['rf']=vei_data_3['f']/count
vei_data_3['crf']=vei_data_3['rf'].cumsum()
vei_data_3.index = vei_data_3.index.astype("int")
index = pd.Index([0,1,2,3,4,5,6,7], name='VEI')
cols = pd.MultiIndex.from_tuples([ ("All eruptions", "f"),
("All eruptions", "cf"),
("All eruptions", "rf"),
("All eruptions", "crf"),
("Confirmed Eruptions", "f"),
("Confirmed Eruptions", "cf"),
("Confirmed Eruptions", "rf"),
("Confirmed Eruptions", "crf"),
("Uncertain Eruptions", "f"),
("Uncertain Eruptions", "cf"),
("Uncertain Eruptions", "rf"),
("Uncertain Eruptions", "crf")])
data=pd.concat([vei_data_1,vei_data_2,vei_data_3],axis=1)
vei_data = pd.DataFrame(data.values, columns=cols,index=index)
dfi.export(vei_data.style.format({('All eruptions','rf'):'{:.4f}',('All eruptions','crf'):'{:.4f}',('Confirmed Eruptions','rf'):'{:.4f}',('Confirmed Eruptions','crf'):'{:.4f}',('Uncertain Eruptions','rf'):'{:.4f}',('Uncertain Eruptions','crf'):'{:.4f}'}, precision=0), 'zliczenia.png')
vei_data.style.format({('All eruptions','rf'):'{:.4f}',('All eruptions','crf'):'{:.4f}',('Confirmed Eruptions','rf'):'{:.4f}',('Confirmed Eruptions','crf'):'{:.4f}',('Uncertain Eruptions','rf'):'{:.4f}',('Uncertain Eruptions','crf'):'{:.4f}'}, precision=0)
| All eruptions | Confirmed Eruptions | Uncertain Eruptions | ||||||||||
|---|---|---|---|---|---|---|---|---|---|---|---|---|
| f | cf | rf | crf | f | cf | rf | crf | f | cf | rf | crf | |
| VEI | ||||||||||||
| 0 | 1007 | 1007 | 0.1215 | 0.1215 | 803 | 803 | 0.1051 | 0.1051 | 204 | 204 | 0.3163 | 0.3163 |
| 1 | 1384 | 2391 | 0.1670 | 0.2886 | 1227 | 2030 | 0.1606 | 0.2657 | 157 | 361 | 0.2434 | 0.5597 |
| 2 | 3991 | 6382 | 0.4817 | 0.7703 | 3727 | 5757 | 0.4878 | 0.7535 | 264 | 625 | 0.4093 | 0.9690 |
| 3 | 1152 | 7534 | 0.1390 | 0.9094 | 1133 | 6890 | 0.1483 | 0.9018 | 19 | 644 | 0.0295 | 0.9984 |
| 4 | 511 | 8045 | 0.0617 | 0.9710 | 510 | 7400 | 0.0668 | 0.9686 | 1 | 645 | 0.0016 | 1.0000 |
| 5 | 180 | 8225 | 0.0217 | 0.9928 | 180 | 7580 | 0.0236 | 0.9921 | nan | nan | nan | nan |
| 6 | 53 | 8278 | 0.0064 | 0.9992 | 53 | 7633 | 0.0069 | 0.9991 | nan | nan | nan | nan |
| 7 | 7 | 8285 | 0.0008 | 1.0000 | 7 | 7640 | 0.0009 | 1.0000 | nan | nan | nan | nan |
sns.set_style("white")
fig,ax=plt.subplots(1,3,figsize=(13,5))
fig.suptitle('Występowanie poszczególnych kategorii wybuchów wulkanów', size=18)
ax02=plt.twinx(ax[0])
ax02.set_ylim([0,1.1])
ax02.spines['left'].set_color('blue')
ax02.spines['left'].set_linewidth(2)
ax[0].set_ylim([0,4000])
ax[0].spines['right'].set_color('red')
ax[0].spines['right'].set_linewidth(2)
sns.barplot(data=vei_data['All eruptions'], x=vei_data['All eruptions'].index, y='f', ax=ax[0], color='blue')
sns.lineplot(data=vei_data['All eruptions'], x='VEI', y='crf', ax=ax02, color='red')
ax[0].set_title('Wszystkie wybuchy', size=16)
ax[0].set_ylabel('Ilość wystąpień')
ax02.set_ylabel('Skumulowana częstość wystąpień')
ax12=plt.twinx(ax[1])
ax12.set_ylim([0,1.1])
ax12.spines['left'].set_color('blue')
ax12.spines['left'].set_linewidth(2)
ax[1].set_ylim([0,4000])
ax[1].spines['right'].set_color('red')
ax[1].spines['right'].set_linewidth(2)
sns.barplot(data=vei_data['Confirmed Eruptions'], x=vei_data['Confirmed Eruptions'].index, y='f', ax=ax[1], color='blue')
sns.lineplot(data=vei_data['Confirmed Eruptions'], x='VEI', y='crf', ax=ax12, color='red')
ax[1].set_title('Potwierdzone wybuchy', size=16)
ax[1].set_ylabel('Ilość wystąpień')
ax12.set_ylabel('Skumulowana częstość wystąpień')
ax22=plt.twinx(ax[2])
ax22.set_ylim([0,1.1])
ax22.spines['left'].set_color('blue')
ax22.spines['left'].set_linewidth(2)
ax[2].set_ylim([0,4000])
ax[2].spines['right'].set_color('red')
ax[2].spines['right'].set_linewidth(2)
sns.barplot(data=vei_data['Uncertain Eruptions'], x=vei_data['Uncertain Eruptions'].index, y='f', ax=ax[2], color='blue')
sns.lineplot(data=vei_data['Uncertain Eruptions'], x='VEI', y='crf', ax=ax22, color='red')
ax[2].set_title('Niepewne wybuchy', size=16)
ax[2].set_ylabel('Ilość wystąpień')
ax22.set_ylabel('Skumulowana częstość wystąpień')
fig.tight_layout(w_pad=3)
fig.savefig("wykresy.png")
plt.show()
vei=sorted(eruptions_data["VEI"].unique())
vei.append("All")
eruptions_data['Evidence Method']=eruptions_data['Evidence Method'].str.strip()
data=eruptions_data
types=list(set(list(data["Evidence Type"])))
indexes=pd.DataFrame()
for i in range(len(types)):
indexes=pd.concat([indexes,data[data["Evidence Type"]==types[i]][["Evidence Type","Evidence Method"]].drop_duplicates()])
idxx=pd.MultiIndex.from_arrays([indexes["Evidence Type"],indexes["Evidence Method"]])
evidence_data=pd.DataFrame(columns=vei,index=idxx)
tab_indexes=evidence_data.index
data_temp=eruptions_data.groupby(["VEI","Evidence Type","Evidence Method"]).count().reset_index()
data_temp=data_temp[["VEI","Evidence Type","Evidence Method","Volcano Name"]]
for j in range(len(tab_indexes)):
res=pd.DataFrame()
for i in range(0,8):
res=pd.concat([res,data_temp[(data_temp["VEI"]==i)&(data_temp["Evidence Type"]==tab_indexes[j][0])&(data_temp["Evidence Method"]==tab_indexes[j][1])]])
res.reset_index(drop=True,inplace=True)
for i in range(0,8):
if i not in res["VEI"].values:
evidence_data.loc[tab_indexes[j],i]=0
else:
evidence_data.loc[tab_indexes[j],i]=int(res[res["VEI"]==i]["Volcano Name"].values)
evidence_data.loc[tab_indexes[j],"All"]=sum(res["Volcano Name"].values)
evidence_data.columns.name="VEI"
evidence_data.columns=evidence_data.columns.map(lambda x: int(x) if x!= "All" else "All" )
dfi.export(evidence_data,"Methods.png", dpi=200, fontsize=8)
evidence_data_sorted=evidence_data.sort_values(axis=0,by="All",ascending=False).head(3)
dfi.export(evidence_data_sorted,"sorted_methods1.png")
dfi.export(evidence_data.sort_values(axis=0,by=7,ascending=False).head(2),"stronges.png")
evidence_data
| VEI | 0 | 1 | 2 | 3 | 4 | 5 | 6 | 7 | All | |
|---|---|---|---|---|---|---|---|---|---|---|
| Evidence Type | Evidence Method | |||||||||
| Isotopic | Uranium-series | 24 | 0 | 0 | 0 | 0 | 0 | 0 | 0 | 24 |
| 14C (calibrated) | 41 | 12 | 49 | 100 | 105 | 70 | 21 | 3 | 401 | |
| 14C (uncalibrated) | 125 | 7 | 34 | 54 | 91 | 41 | 19 | 1 | 372 | |
| Cosmic Ray Exposure | 20 | 1 | 0 | 0 | 1 | 0 | 0 | 0 | 22 | |
| Ar/Ar | 12 | 1 | 0 | 0 | 1 | 1 | 0 | 0 | 15 | |
| K/Ar | 10 | 0 | 0 | 1 | 0 | 0 | 0 | 0 | 11 | |
| Sidereal | Varve Count | 0 | 1 | 66 | 8 | 1 | 0 | 0 | 0 | 76 |
| Dendrochronology | 0 | 0 | 0 | 1 | 2 | 3 | 0 | 0 | 6 | |
| Ice Core | 0 | 0 | 3 | 0 | 3 | 0 | 1 | 2 | 9 | |
| Uncertain | Unspecified | 204 | 138 | 271 | 22 | 1 | 0 | 0 | 0 | 636 |
| Correlation | Magnetism | 34 | 0 | 5 | 0 | 2 | 0 | 0 | 0 | 41 |
| Tephrochronology | 71 | 16 | 122 | 124 | 103 | 22 | 5 | 0 | 463 | |
| Anthropology | 4 | 1 | 5 | 2 | 6 | 1 | 0 | 0 | 19 | |
| Radiogenic | Fission track | 0 | 0 | 0 | 1 | 0 | 0 | 0 | 0 | 1 |
| Thermoluminescence | 1 | 0 | 0 | 0 | 1 | 0 | 0 | 0 | 2 | |
| Observations | Reported | 376 | 1200 | 3430 | 837 | 194 | 42 | 7 | 1 | 6087 |
| Satellite (infrared) | 1 | 0 | 1 | 1 | 0 | 0 | 0 | 0 | 3 | |
| Satellite (visual) | 0 | 2 | 3 | 1 | 0 | 0 | 0 | 0 | 6 | |
| Seismicity | 15 | 0 | 1 | 0 | 0 | 0 | 0 | 0 | 16 | |
| Hydrophonic | 68 | 3 | 0 | 0 | 0 | 0 | 0 | 0 | 71 | |
| Photo / Video | 1 | 1 | 1 | 0 | 0 | 0 | 0 | 0 | 3 | |
| Aviation | 0 | 1 | 0 | 0 | 0 | 0 | 0 | 0 | 1 |
sns.set_style("white")
fig,ax=plt.subplots(2,1,figsize=(12,9))
fig.suptitle('Wystąpienia zarejestrowanych erupcji wulkanów', size=28)
sns.stripplot(data=eruptions_data,x="VEI",y="Start Year",s=2,ax=ax[0])
ax[0].xaxis.set_major_formatter(lambda x,pos:int(x))
ax[0].set_xlabel("VEI",size=12)
ax[0].set_ylabel("Rok erupcji",size=12)
ax[0].set_title("Erupcje podzielone ze względu na VEI",size=16)
sns.stripplot(data=eruptions_data,x="VEI",y="Start Year",s=1.5,ax=ax[1],hue="Evidence Type",dodge=True)
ax[1].xaxis.set_major_formatter(lambda x,pos:int(x))
ax[1].set_xlabel("VEI",size=12)
ax[1].set_ylabel("Rok erupcji",size=12)
ax[1].set_title("Erupcje podzielone ze względu na VEI i rodzaj dowodu",size=16)
ax[1].legend(bbox_to_anchor=(1.15, 1.02),loc="upper right")
fig.tight_layout()
fig.savefig("wykresy2.png")
plt.show()
eruptions_data=pd.read_csv('eruptions_data.csv')
duration = eruptions_data[['Volcano Name', 'Start Year', 'End Year']].copy()
duration['Duration (years)']=duration['End Year']-duration['Start Year']
dfi.export(duration.sort_values('Duration (years)', ascending=False).head(10).style.format(precision=0),'najdluzsze.png')
duration.sort_values('Duration (years)', ascending=False).head(10).style.format(precision=0)
| Volcano Name | Start Year | End Year | Duration (years) | |
|---|---|---|---|---|
| 6871 | Yasur | 1270 | 2022 | 752 |
| 6586 | Stromboli | 1558 | 1857 | 299 |
| 6692 | Fogo | 1500 | 1761 | 261 |
| 6050 | Sangay | 1728 | 1916 | 188 |
| 3520 | Santa Maria | 1922 | 2022 | 100 |
| 3187 | Dukono | 1933 | 2022 | 89 |
| 3165 | Stromboli | 1934 | 2022 | 88 |
| 3155 | Sangay | 1934 | 2011 | 77 |
| 5471 | Kilauea | 1823 | 1894 | 71 |
| 6265 | Galeras | 1670 | 1736 | 66 |